Acid deposition scenarios used in the simulations follow the existing protocols for reduction of sulphur and nitrogen. Map 1 shows the computed sulphur deposition in 1990 and Map 2 shows the effects of the proposed abatement strategy on the sulphur deposition in Europe in 2060. The maps indicate that in western and central Europe deposition quantities are substantially reduced. On the other hand, in some areas in south -eastern and southern Europe with high sulphur deposition in 1990 hardly any reduction is achieved. The effects of the reduction in NOx emissions in 1990 and 2060 are shown on Maps 3 and 4. These maps show that some reduction in deposition is achieved, but reduction percentages are much lower than for sulphur. Reductions in NH3 emission (not shown) are also low compared to reductions in sulphur. As a consequence, total N deposition in central and western Europe remains relatively high.
Climate change was derived by linear interpolation between present day climate (Leemans and Cramer 1990) and climate in the year 2100 derived from assessment with the IMAGE model (Alcamo 1994). Maps 5 and 6 show the effects of climate change on the yearly rainfall. According to the scenario, rainfall decreases in south-western Europe but increases in central Europe. In Scandinavia and south-eastern Europe rainfall quantities do not show substantial changes. The computed change in temperature is shown on Maps 7 and 8. The maps show an increase in temperature over Europe of 2-4 degrees in the period 1990 - 2060.
To validate the results of the initialisation procedure the median value of computed pH values for each grid cell for the year 1995 was compared to measured values from the period 1994-1996 in the same grid cell. These measured values were derived from Van Mechelen et al. (1997) who describe the results of an European wide forest soil inventory. In this inventory about 4500 plots in 23 European countries were sampled and analysed and it therefore forms an excellent basis for a European wide comparison of simulated and measured soil characteristics. Map 9 shows the measured pH values whereas Map 10 shows the simulated values. For most of Europe a reasonable accordance between simulated and measured values is found, although for some regions the simulated pH is higher than the measured one. It should be noted however, that the measurements were made on a systematic 16*16 km grid and therefore might not be a good indication of the median value in a 0.5 * 0.5 º grid cell. For some of the regions where pH is overestimated, the 5 percentile of computed pH values compares (much) better with the measurements than the median value. A comparison of measured and simulated base saturation (not shown) could only be made for a limited number of countries because measurements are available for only 2800 of the 4500 plots (Van Mechelen et al. 1997). In general the agreement between measured and simulated values is reasonable, although locally differences can be substantial. Again, this can be partly due to the fact that the measurements are not a proper estimate of the grid median value.
To evaluate the effects of acid deposition reduction and climate change, comparisons where made between simulated soil chemical status in 1990 and 2060. To this end simulations were made with emission reductions of SO2 , NOx and NH3 alone and with both emission reductions and climate change.
Simulated effects of emission reductions of S and N on the aluminium concentration are shown on Map 11 (aluminium concentration in 1990) and Map 12 (aluminium concentration in 2060). These maps show that the emission reductions (of mainly sulphur) lead to lower aluminium concentrations in 2060 compared to 1990. Nevertheless, potentially harmful concentrations (> 0.2 eq/m3) persist in parts of central and western Europe and close to the Kola peninsula. The effects of emission reductions on nitrate concentrations in 2060 compared to 1990 are shown on Map 13 and Map 14 respectively. Because the deposition of nitrogen is not substantially reduced, nitrate concentrations remain high in western and central Europe and the area with nitrogen saturated soils increases. Similar predictions were made with an earlier version of the SMART model (De Vries et al. 1994). These simulations indicate that the combined emission reduction in sulphur and nitrogen leads to a partial recovery from severe acidification in terms of lower aluminium concentrations, but the reduction in nitrogen emission is not sufficient to reduce nitrate concentrations in areas where present concentrations are already high.
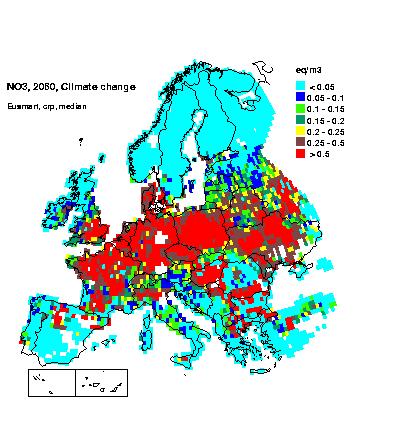
The combined effects of emission reduction and climate change on nitrate concentrations in 2060 are given on Map 15. Climate change increases the amount of nitrogen released to the soil solution by enhanced mineralization of organic matter because of rising temperatures but this is counteracted by the increased removal of nitrogen from the system through enhanced growth. The simulated net-effect , however, is a higher input of N to the soil solution since temperature effects on mineralisation implemented in the model are stronger than on growth (Kirschbaum 1997). Furthermore climate change influences the precipitation excess through changes in yearly rainfall (see Map 5 and Map 6). As a consequence of climate change, the area with nitrate concentrations above 0.1 eq/m3 increases due to a higher N input but in central Europe concentrations decrease due to a higher yearly precipitation excess in this area (dilution effect). It is important to realise however, that although concentrations are somewhat lower in central Europe in 2060 than in 1990, the leaching of nitrate strongly increases due to the much higher precipitation excess. Combined effects of emission reduction and climate change on the aluminium concentration are given on Map 16. Compared to effects of deposition reduction alone (Map 12) the area with aluminium in soil solution decreases as a result of three different processes. A decrease in the solubility of aluminium hydroxides at higher temperatures leads to lower concentrations, an effect that is partly compensated by increased NO3 input at higher temperatures. In central Europe, aluminium concentrations decrease due to the above mentioned dilution effect of increased precipitation excess.
The simulated effects of emission reduction of sulphur and nitrogen and climate change on the European scale presented above have a high uncertainty, due to uncertainties in data and to process simplifications in the model. Regarding the uncertainty in input data, soil characteristics were derived from available databases and might therefore not reflect local circumstances. Secondly, there are uncertainties in the scenarios for climate change and deposition. Uncertainties due to model structure stem from the fact that the modelling of processes with respect to nitrogen (immobilisation and mineralisation) is a (strong) simplification of reality. Furthermore, the modelling of climate change effects strongly depends on the assumed dependency of geochemical and biological processes on temperature. Effects of temperature on mineralization of soil organic matter (expressed in Q10 values) found in literature vary strongly (e.g. Kirschbaum 1995, Walse et al. 1998, Wright et al. 1998) and because simulated effects are strongly influenced by the Q10 value chosen, results of the scenario evaluations are uncertain. Evaluation of climate change effects, e.g. with SMART, can be improved with a better description of N-related processes and their dependence on temperature. To this end more knowledge is needed on e.g. variations in Q10 values and their relation to site characteristics and measurement conditions.